
Profiling Rust Code on macOS: My Daily Workflow
- Medcl
- Rust , Performance
- December 11, 2024
Table of Contents
Profiling Rust code has become part of my daily routine. As I primarily develop on macOS, I’ve noticed there aren’t many tools that allow for easy and quick profiling of Rust applications. So, I’d like to share my daily profiling workflow, in case it helps others. If you have other approaches or tools that work well for you, feel free to share—I’d love to hear them!
Setting Up Micro-Benchmarks
I use micro-benchmark tests to track the performance of critical functions in my Rust application. For this, I rely on criterion, which is both powerful and easy to use. Here’s what my project setup looks like:
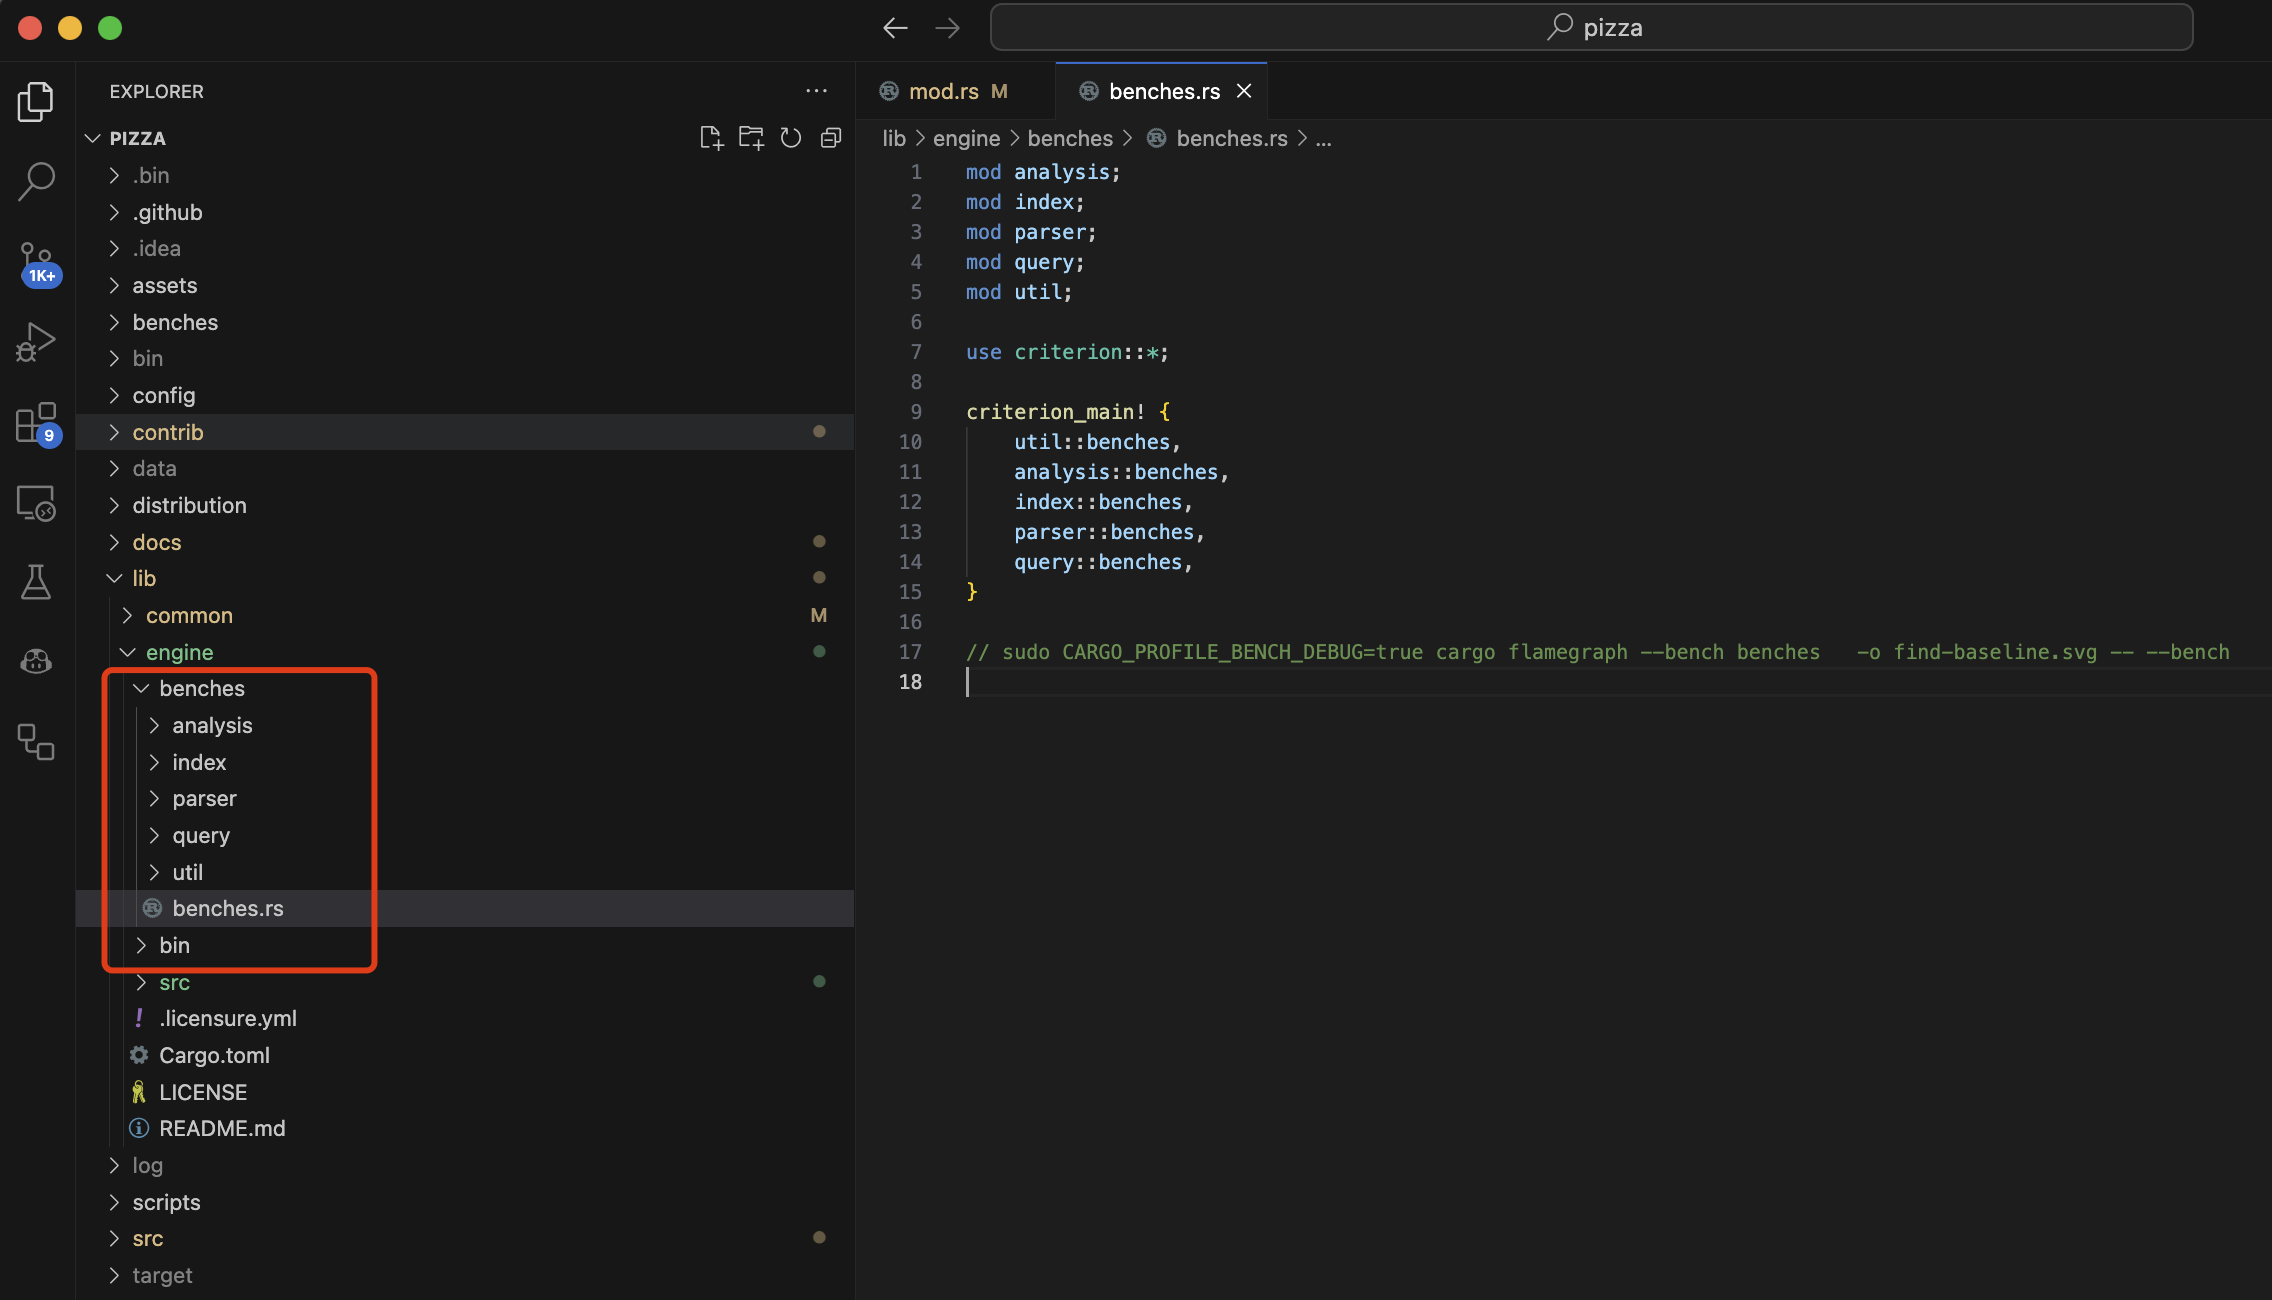
As you noticed, i organized my benchmark tests per module, and so i can easily include or exclude specify tests in the benches.rs, some times, they just take too much time, if i only want to profile specify tests, i can just comment out unrelated one. dirty but works.
If you have many similar tests, you may group them by use a customized name, like this:
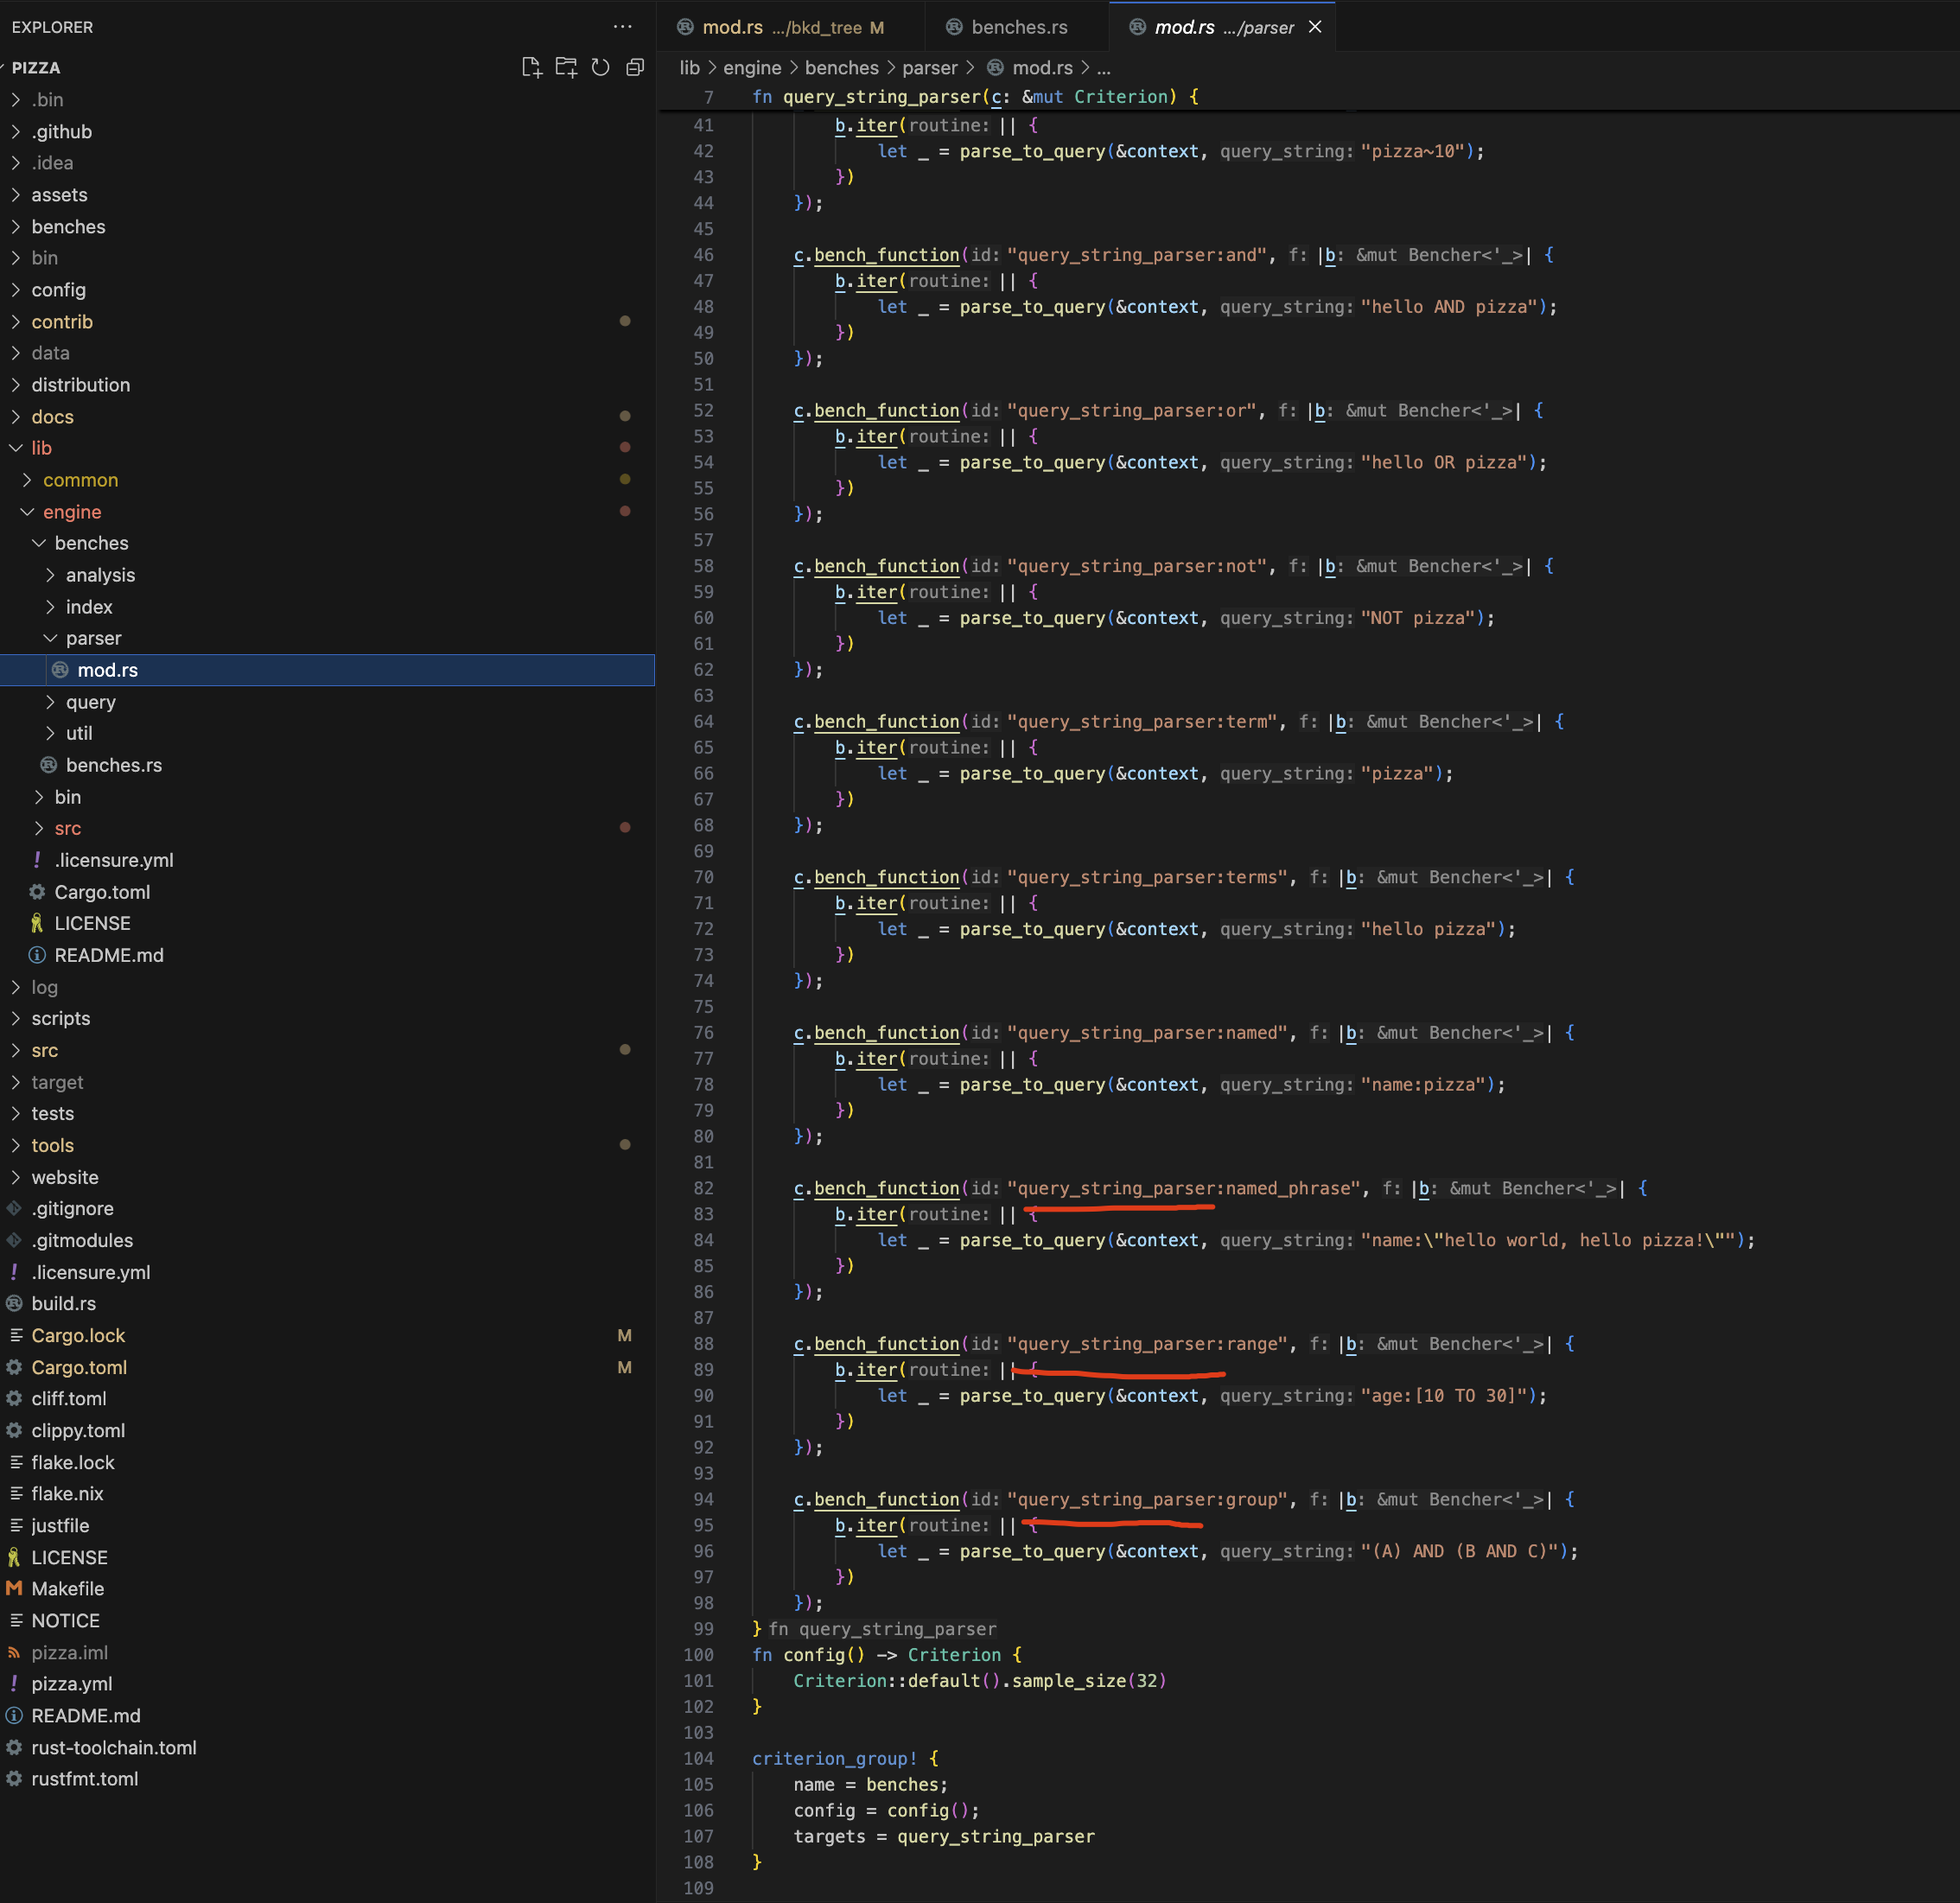
Micro-benchmarking is a fundamental step that helps track performance changes when refactoring code or adding new features.
Profiling The Micro-Benchmark
What if some tests are slow, a quick way to profiling is to use:
sudo CARGO_PROFILE_BENCH_DEBUG=true cargo flamegraph --bench benches -o find-baseline.svg -- --bench
You can run the benchmarks with a single command, but be sure to comment out any unrelated tests in benches.rs. Just remember to revert those changes or avoid checking them in later. that’s tedious, yes, i know :(
Tracking Performance with Bencher
Now that you have several micro-benchmark tests, how can you continuously monitor performance? I’m glad I discovered a free service provided by bencher.dev. It helps track performance over time, making it easier to identify any regressions or improvements.

Here is my bencher command in my Makefile:
bencher-engine:
    if [ -z "${BENCHER_API_TOKEN:-}" ]; then \
        echo "Error: BENCHER_API_TOKEN environment variable is not set."; \
        exit 1; \
    fi

    bencher run \
        --project pizza-engine-bd8p44nc \
        --branch main \
        --testbed localhost \
        --adapter rust_criterion \
        "cd lib/engine && cargo bench"
Each time you run make bencher-engine, it executes all your benchmarks and sends the results to their database. This service is free to use for open-source projects, making it a great resource for ongoing performance tracking.
For example here is my dashboard:
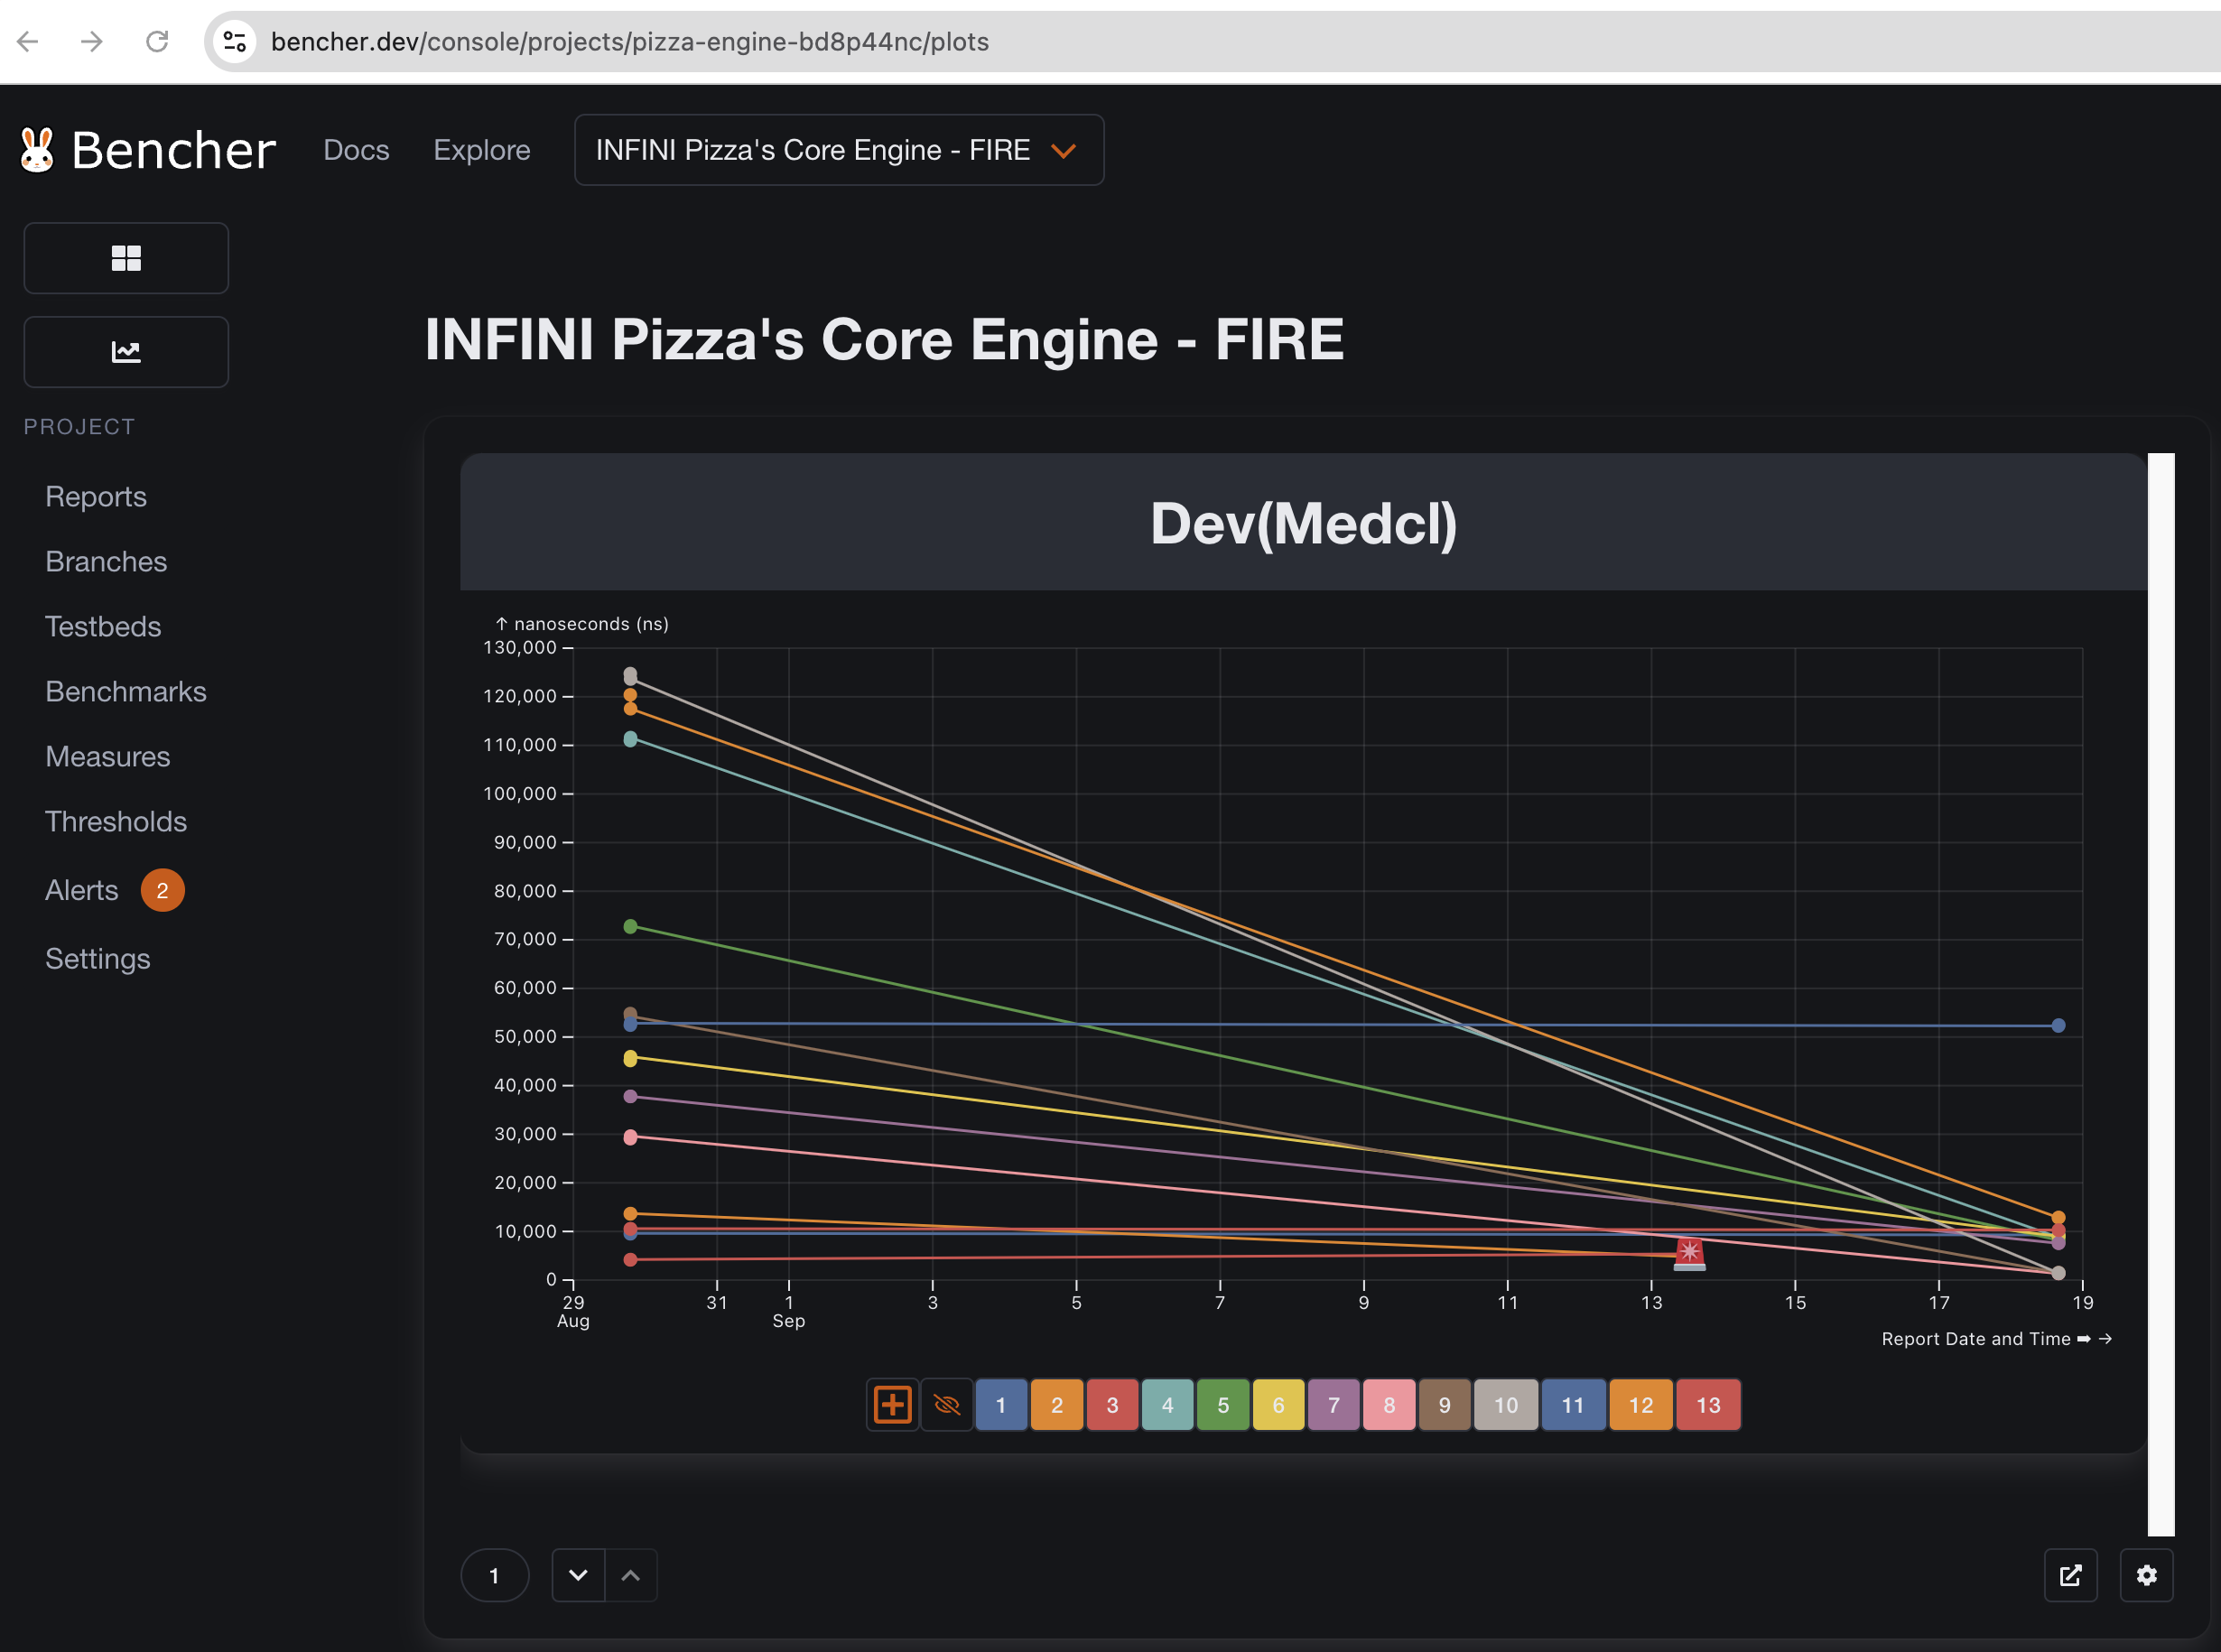
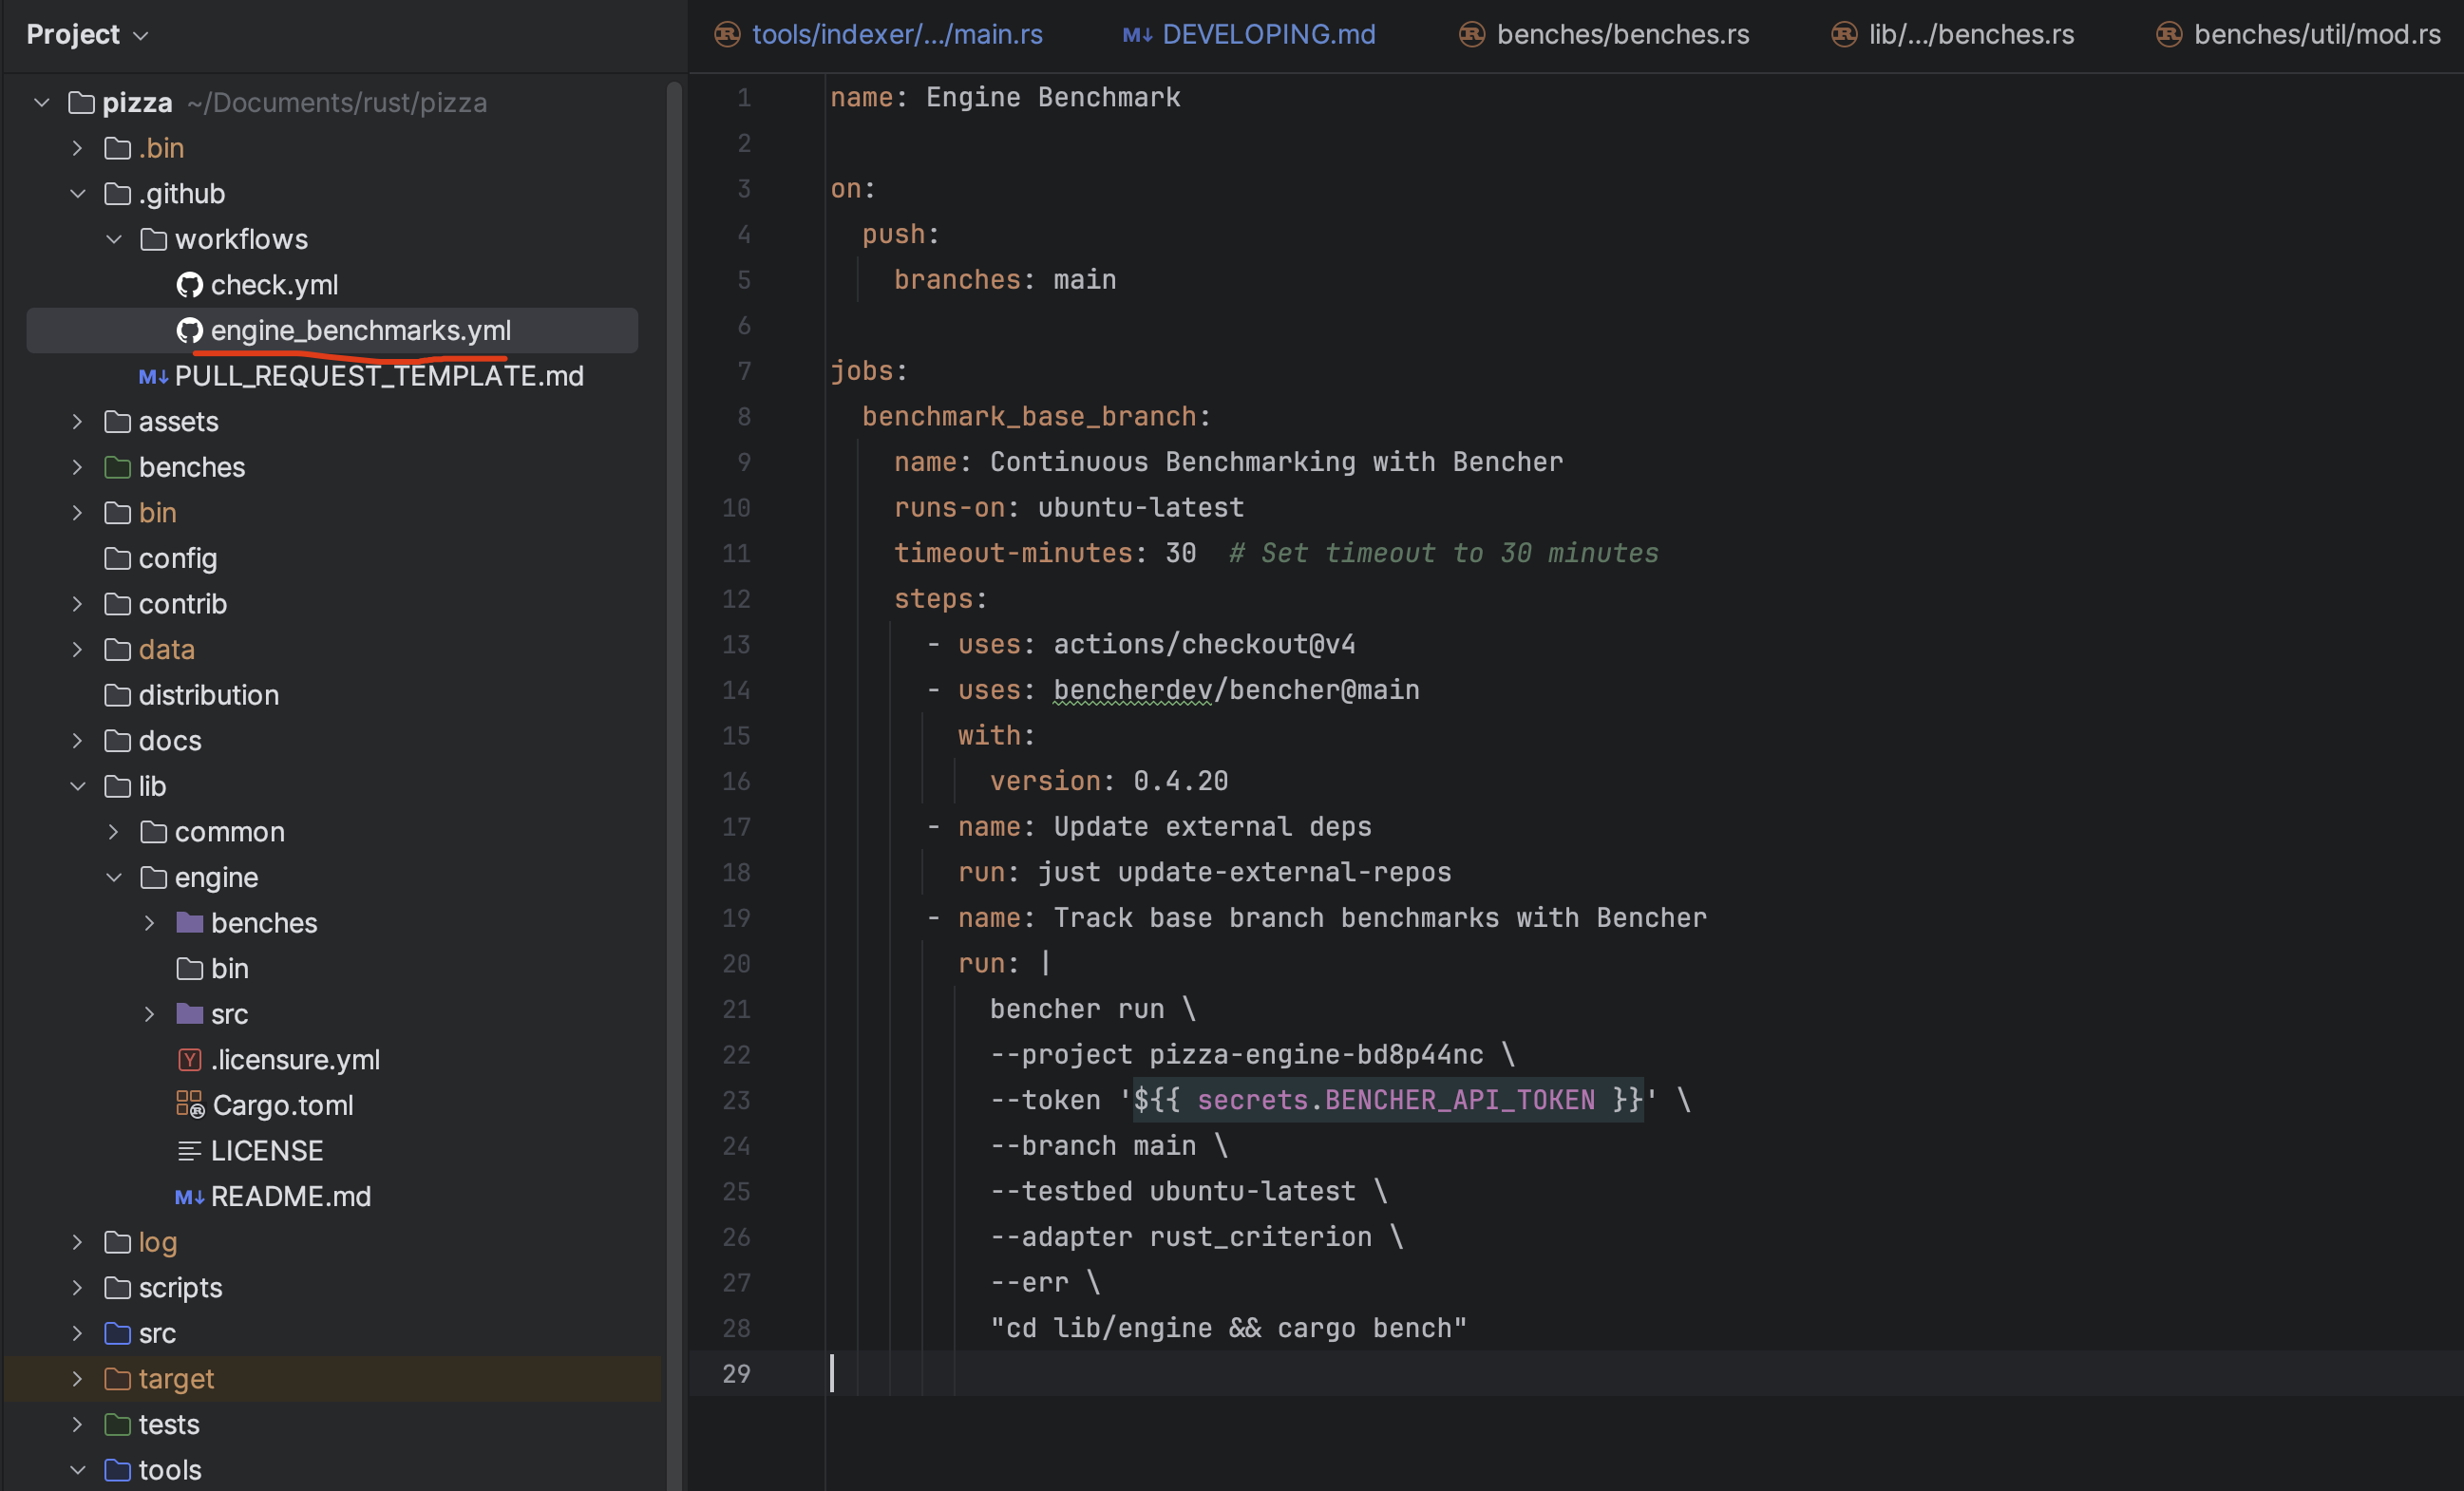
You can add a CI action to your GitHub repository to automatically track performance changes with each commit. If your code is hosted on GitHub, this setup will record performance variations for every commit, helping you maintain a history of your application’s performance over time.
Profiling on MacOs
Profiling on macOS can be slightly less convenient than on Linux, where there are many robust tools available. Here’s what I do to make the most of the profiling process, I use Dtrace along with two scripts:
➜ cat ~/start_profile.sh
#!/bin/bash

# Check if PID argument is provided
if [ -z "$1" ]; then
  echo "Usage: $0 <pid>"
  exit 1
fi

pid=$1

# Run dtrace with the provided PID
sudo rm -rf target/out.user_stacks || true

sudo dtrace -x ustackframes=100 -n "profile-97 /pid == $pid/ { @[ustack()] = count(); } tick-60s { exit(0); }" -o target/out.user_stacks

➜ cat ~/end_profile.sh
#!/bin/bash

# Clean up previous output files
rm -f target/stacks.folded target/flamegraph.svg

# Process the new profiling data
cat target/out.user_stacks | inferno-collapse-dtrace > target/stacks.folded
cat target/stacks.folded | inferno-flamegraph > target/flamegraph.svg

# Notify the user
echo "Flamegraph generated at target/flamegraph.svg"
And then start your target Rust application, make sure you set debug=true in Cargo.toml
And then execute the start script, wait for a while and Ctrl+C to capture profiling data:
➜  indexer git:(batch_indexing) ✗ ~/start_profile.sh 1494
dtrace: system integrity protection is on, some features will not be available

dtrace: description 'profile-97 ' matched 2 probes
^C%
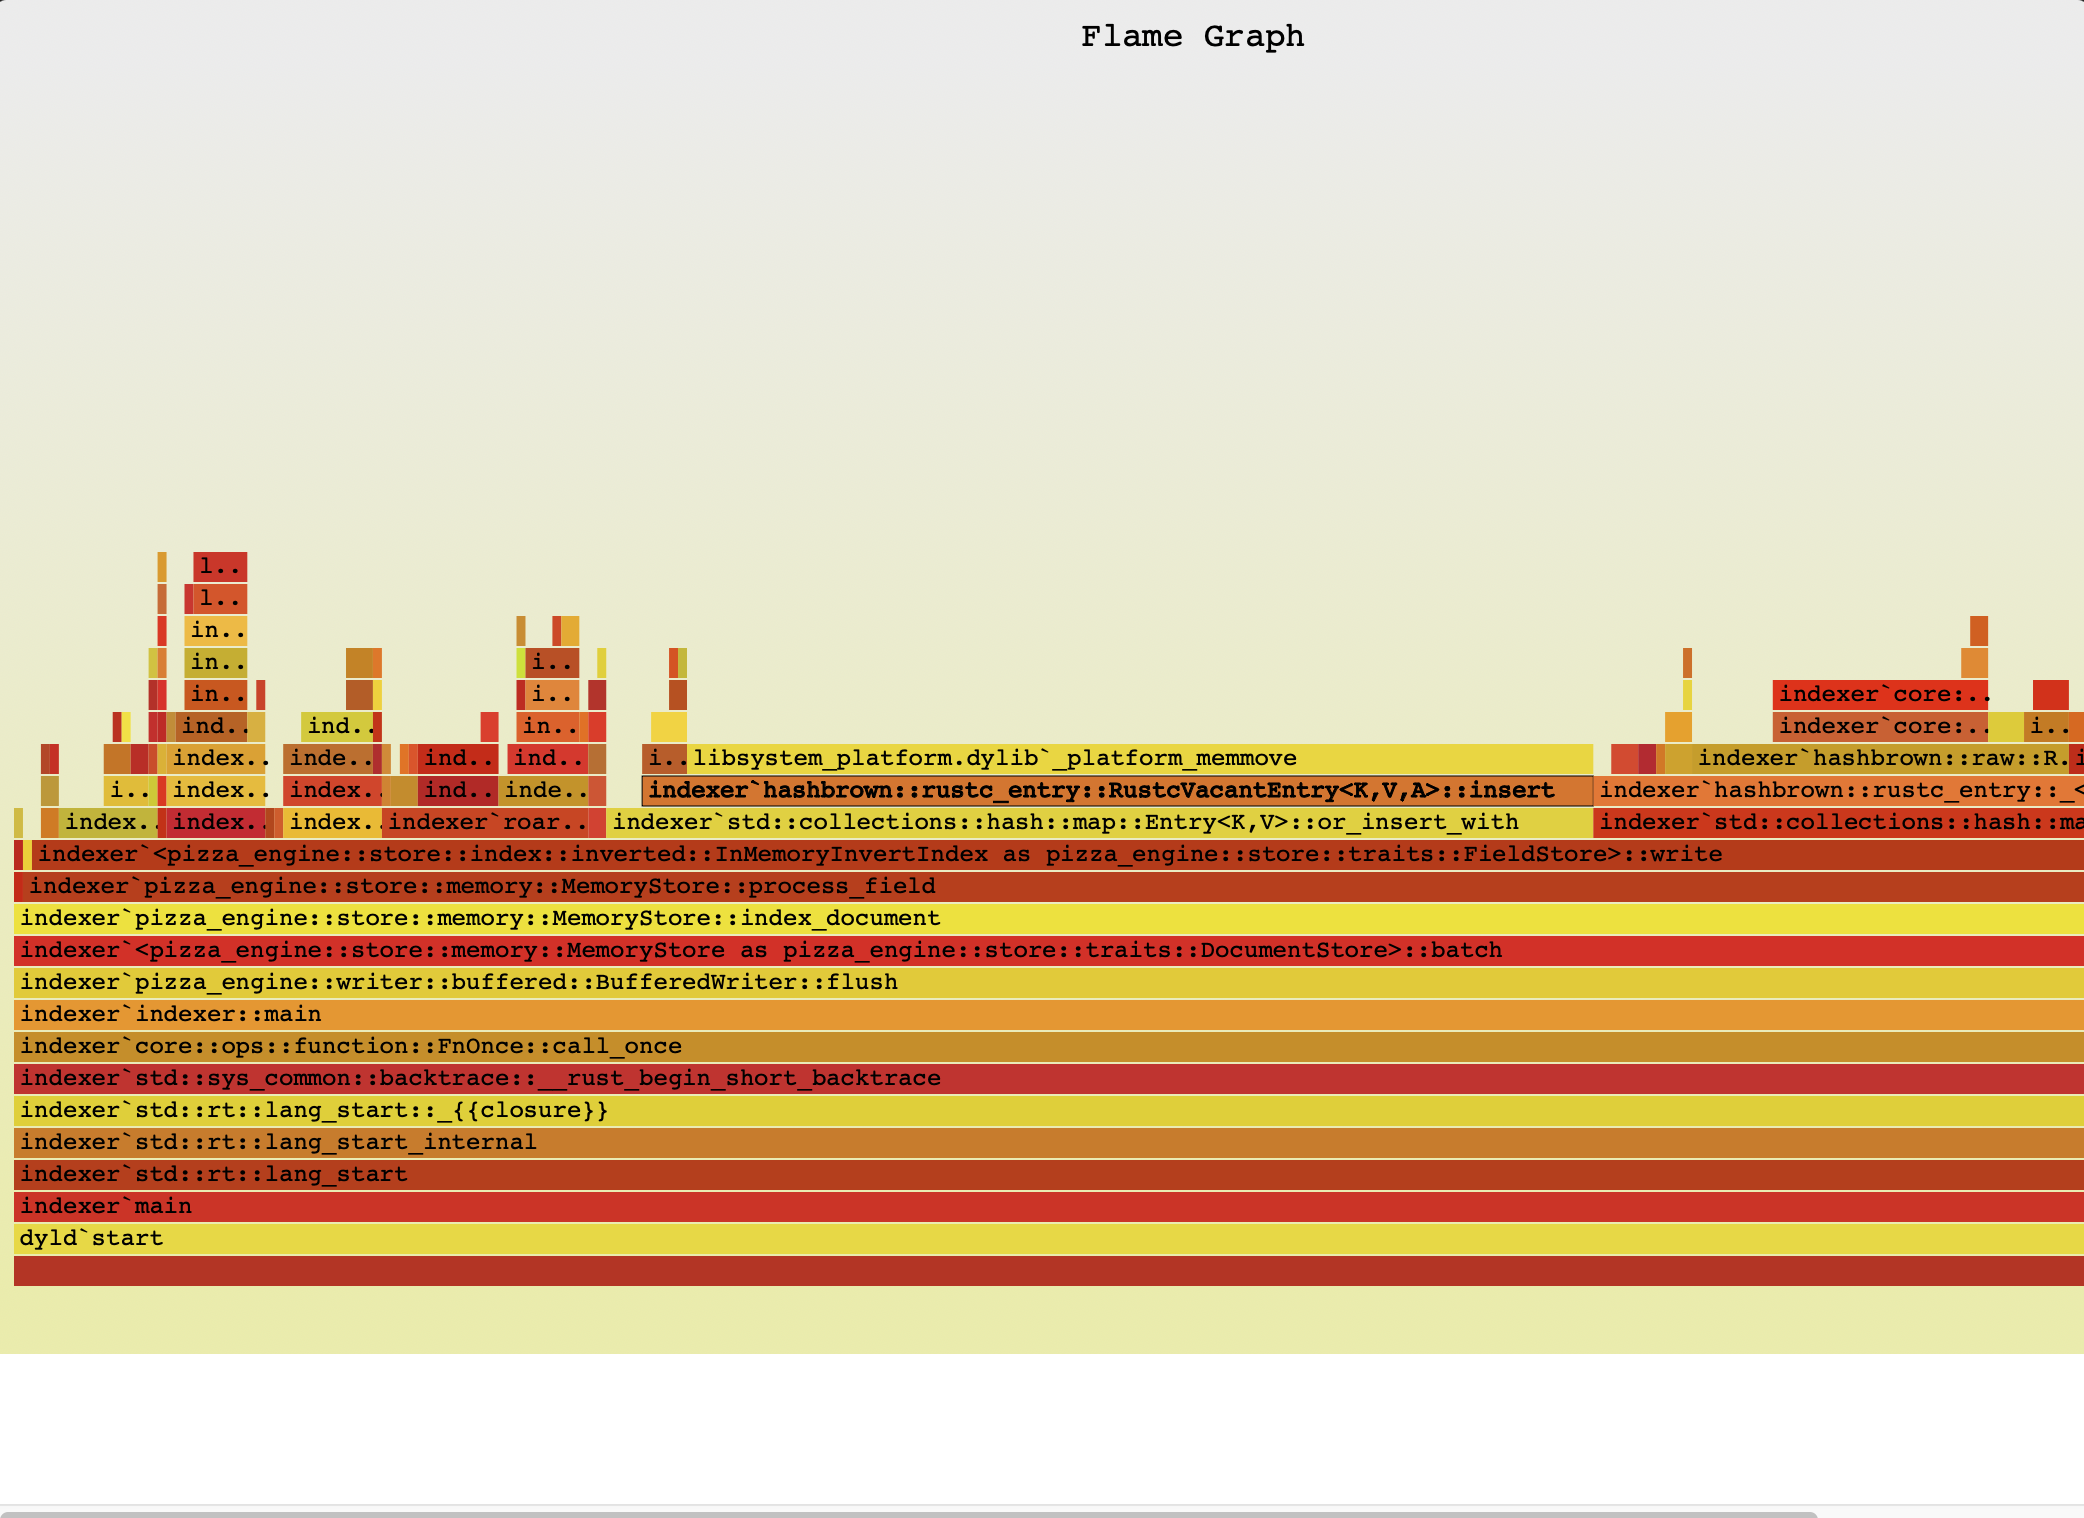
And then you can generate the flamegraph:
➜  indexer git:(batch_indexing) ✗ ~/end_profile.sh
Flamegraph generated at target/flamegraph.svg
Open it with your web browser and figure out what’s the bottlenect, and rock with it.
That’s it! I hope this information helps you in your Rust development journey. If you have any questions or need further assistance, feel free to reach out!
References: